
Introduction

When it comes to trading the markets, we are always inundated with so much of information (I call it as ‘Information constipation’) that we could no longer see the forest but obsessed with just seeing the trees. The process of trading or speculation (as they call it), has morphed into a pseudo-intellectual science and consequentially, traders think that they must strain their brains to profit. Trading, however, is anything but an intellectual exertion. In fact, the more we use our brain in trading, the more likely we are to find ourselves with negative P&L.
I have actively traded my own account for the last 12+ years and let me be honest – the initial few years were marked by lots of trial and error. A good mentor can obviously shorten that learning curve but that is besides the scope of this post. Becoming a consistently successful trader has got nothing to do with education and I can vouch for it. My success in trading has got nothing to do with my postgraduate degree. In fact, my formal schooling did more to hinder my ability to trade than help. Graduate school filled my head with lot of abstractions and theory but did nothing towards advancing my common sense. It caused me to think a lot about the ‘right way’ to trade, and the harder I thought, the farther I was going away from the basics of trading.
Trading is not so fundamentally difficult, but the print/visual media wants us to feel so. They have their own business reasons for it. Trading the markets can offer fantastic opportunities to make money but it is at the same time, the most self-revealing career anyone can ever choose. Now, one may wonder why this rhetoric but think about it. If any of us can structurally identify what the markets are doing currently rather than trying to ‘predict’ what the markets are going to do, job is 75% done. We don’t need to predict as we don’t know ourselves what we would be thinking this time next week. Neither can anyone know what the markets will be doing this time next week. We all trade our own belief systems. Once we identify the underlying structure of markets, suddenly, trading seems not that difficult. This is where ‘structural pivots’ can be of immense help. Pivots can help us identify the path of least resistance. Think of how, in our own life, we follow the path of least resistance. Following that path has led us to read this blogpost this very instant. Just understanding the underlying structure of the markets has served me well in the past decade.
Floor pivots vs structural pivots
Whenever I use the word ‘Pivot’, the listener always gets baffled on what I really mean as we have another set of pivots that is often talked about. This section is to clear that up a bit.
There is something called ‘floor pivots’. Floor pivots has been used for many years by floor traders to come up with a reference point based on the prices from the previous day. It is calculated based on high, low and close of the previous day. And few lines are drawn above the pivots as resistance and few lines below as support. Most of the technical trading platforms can plot these lines automatically.
The formula is as follows:
Pivot = (H + L + C)/3
Resistance level 1 =(2*P) – L
Support level 1 =(2*P) – H
Resistance level 2 = (P – S1) + R1
Support level 2 = P – (R1 – S1)
I personally find these levels not so useful for trading. Some people think that these levels have meaning because so many floor traders, and now screen based traders, watch them, and they become self-fulfilling. That may be true to some degree. On most trading days, there is no beneficial information at any of these levels. Many attempts have been made to change the formula, such as using the current day’s opening price instead of the previous close. There is little improvement with any of these variations, in my opinion.
An interesting experiment is to draw a line randomly on an intraday chart. Just close the eyes and drop a line using a horizontal line tool and place it anywhere on the chart. Then, watch as prices move away from or toward this line. It will hit and reverse on the randomly drawn line about the same percentage of times as it does off the pivot or the support or resistance levels. The randomness of the placement of the line does not necessarily make it useless. A line drawn anywhere on the chart can be a useful point of reference. With a line on the chart, one has a better sense of the market movements. You can more easily gauge the movement, or acceleration towards or away from this line. It is like being in a boat at night, in a fog, with a lighthouse at some distance away. The lighthouse becomes a point of reference, and you can tell whether you are getting closer to or further away from that point of light.
On the other hand, a structural pivot is a price level that stands out on the chart as a high point and surrounded by lower bars, or for downtrends, a low level that stands out and is surrounded by higher bars. For example, in an uptrend, a price level will be reached that attracts selling and shuts off buying, at least momentarily. Prices will usually fall back somewhat, thus leaving a price bar on the chart that has lower highs on either side. This high price bar then becomes an area to test on the next push higher. Traders mark the structural pivots in myriad number of ways and I have found my own way of marking that helps me understand the underlying structure of the markets in a more systematic/structured way (this will be covered in the first session of my upcoming workshop in Bangalore/Chennai). Pivot points on the chart create excellent reference points to interpret the developing market structure. Some traders refer to these pivots as swing points. Those who view the markets in terms of chaos theory would refer to them as fractals. They are all same concept, just with different names. This way of marking structural pivots has been around from early 90’s.
Trend following and structural pivots
Trend determination is obviously important for trend followers, but anyone trading in any style should be aware of the trend in the market they are trading. The overall trend can influence our trading style. The beginning of a trend can be easier to trade than end of a trend in many cases. Therefore, it is important to know what the trend is.
But to complicate matters, there can be many trends at play in the same market, even on the same chart. There are trends within trends. Different period lengths on a moving averages, or indicator input, can signal a different, often confusing and conflicting trend. There can be a counter trend down move on a 30-minute chart, while the daily chart is showing a powerful uptrend, while the monthly chart is showing a sideways trend. When they all line up, it is the most comfortable and reassuring time to take a trade, but if we wait for everything to be in sync, we you would probably trade very little, and often not in a timely manner (this is a common problem with ‘multi timeframe’ analysis’) And often the comfortable and easy trade is the one everyone sees, and it often turns out to be untimely. My thought, after changing my mind on this issue many times over the years, is to keep it simple and just trade off the time frame of the chart you are analyzing.
Most of us want indicators to guide us, as indicators are quantifiable. We can lean on them with more confidence. However, the purest and fastest way to determine trend is just through studying the price structure. Price does not lag. Price is not derived from anything. It is current. It might frustrate, but it doesn’t lie.
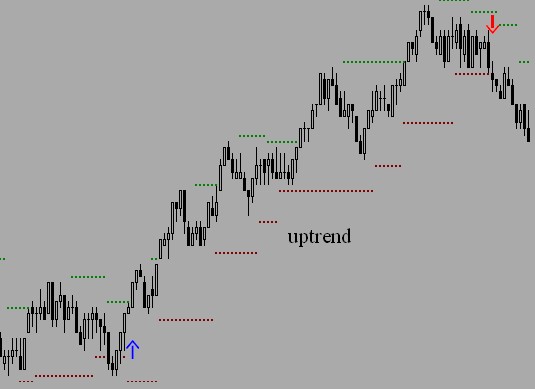
The above chart shows a series of price bars. I took the time frame and market off the chart for this illustration. It really doesn’t matter what time frame is being analyzed. A trend has the same basic structure in all time frames. The red and green horizontal dotted lines are placed at swing points in the price action.
This is the same theory of a market making higher highs and higher lows, although this isn’t always exactly true. Sometimes a pause will form in the price structure and prices temporarily go opposite to the trend with the market making a lower high, but as long as a lower low is not taken out, the uptrend is still intact. On the above chart there is a smooth progression of structural points taken out from the first blue up arrow to the red down arrow on the right. There was only one instance, near the middle of the chart, where there was a slightly lower swing high.
I believe swing points are valid as a breakout strategy because the market views these points as areas to test. If the test fails, the market will test or create a swing point in the opposite direction. If the test is successful, the market will proceed upward, and the old swing point becomes an area of support if the market revisits that neighborhood. The market is constantly testing whether trade is accepting or rejecting price, and these structural points are the reference points for these tests.
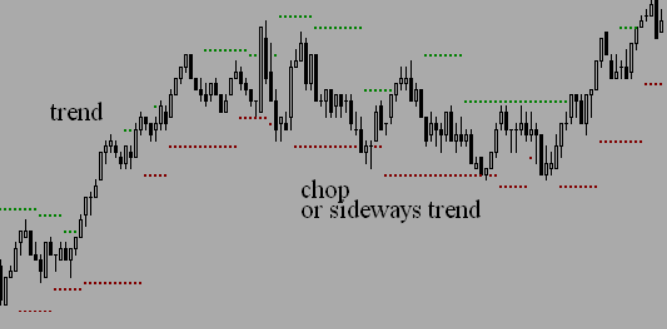
So, what do we do when the market chops like we see in the above picture? There is a way of avoiding these chops atleast 60% of the time if we mark the large pivots (see it as a high/low of a range) on top of the small pivots and trade only if it goes beyond that range. I have 100% mechanical way of marking it, formed rules around it which can be traded mechanically. Most of the structural pivot traders imbibe an element of discretion in their trading (to avoid chop trades) but that is exactly why, those traders suffer the most w.r.t psychological let-downs of the mind.
I should also mention that another trend following approach that was very popular in the past. It is the channel breakout. It worked in a very narrow window of time when markets trended well. The basis of this approach is to buy the breakout of the high of x number of bars ago, or short the breakout to the downside of the low of x number of bars ago. Often a stop is used with the same breakout method, but with a shorter look back period. One of the originators of this method, who was incredibly successful for a time, has not been able to be profitable with it in recent markets, even after many attempts. I think a more valid approach using breakouts is to trade the structural pivots, rather than a fixed lookback. The pivots are dynamic and reflect the structure of the price action. Fixed lookback periods don’t offer a breakout related to market structure. The market is testing structural points to see if price can be accepted or rejected at these points. The market doesn’t care about testing a price bar that occurred 21 bars ago just because it was 21 bars ago.
This has been a long post but I feel a much needed one as I often get questions on what pivots are and how to make a price action idea 100% mechanical in nature (with unbending set of entry/exit/MM rules). That is exactly what I intend to do in my workshops on August 11, 2018 at Bangalore and August 18, 2018 at Chennai. I will be showing how to identify and mark the pivots, how to mark ranges (mechanically), how to create entry/exit rules for this concept that can be traded mechanically and how it has served me well so far
Happy trading all !!